
Mastering the Bid: A Deep Dive into the trackmybids.com Analytics Dashboard
In the fast-paced world of construction, staying on top of estimates and bid submissions is the difference between steady growth and missed opportunities. For companies that manage their own labor and projects directly, having a centralized “source of truth” for performance is vital. The trackmybids.com dashboard provides a comprehensive, visual command center designed to turn raw bid data into actionable business intelligence.
Here is a breakdown of the key features and insights available through the platform’s analytics interface.
High-Level Performance Indicators
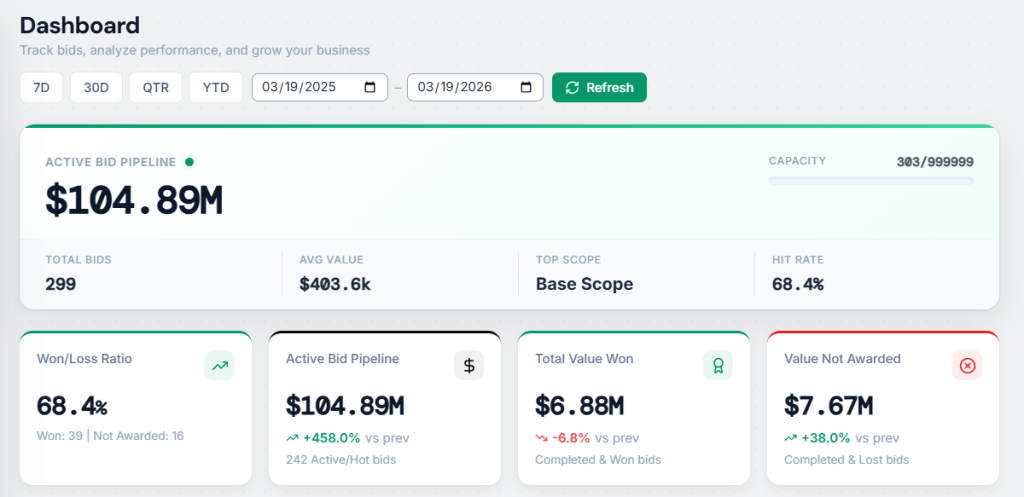
At a glance, the dashboard provides the “Big Four” metrics that define a company’s bidding health. These indicators allow executives and estimators to assess the state of the business in seconds:
- Active Bid Pipeline: Currently sitting at $104.89M, this represents the total volume of work out for tender.
- Total Bids: A count of all active and historical bids (currently 299), showing the sheer volume of estimating output.
- Average Bid Value: With an average of $403.6k, the platform helps users identify their “sweet spot” in terms of project size.
- Hit Rate: A critical metric for any construction firm. The current 68.4% hit rate indicates how efficient your bidding strategy is, successfully converting the majority of estimates into projects.
Dynamic Pipeline Tracking
The dashboard breaks down the financial lifecycle of bids into four distinct categories, comparing current performance against previous periods:
- Won/Loss Ratio: Visualized with a positive trend icon, this highlights the efficiency of the estimating team.
- Pipeline Value Growth: The interface shows an 458% increase in the active pipeline value, signaling an aggressive period of growth or a shift toward larger-scale projects.
- Total Value Won: This tracks the bottom line—$6.88M in completed and won bids. Even if this sees a slight dip (as shown by the -6.8% trend), it allows for immediate course correction.
- Value Not Awarded: By tracking the $7.67M in lost bids, the software provides essential data for “post-mortem” analysis to understand why certain projects were missed.
Visualizing Trends: Submissions and Value
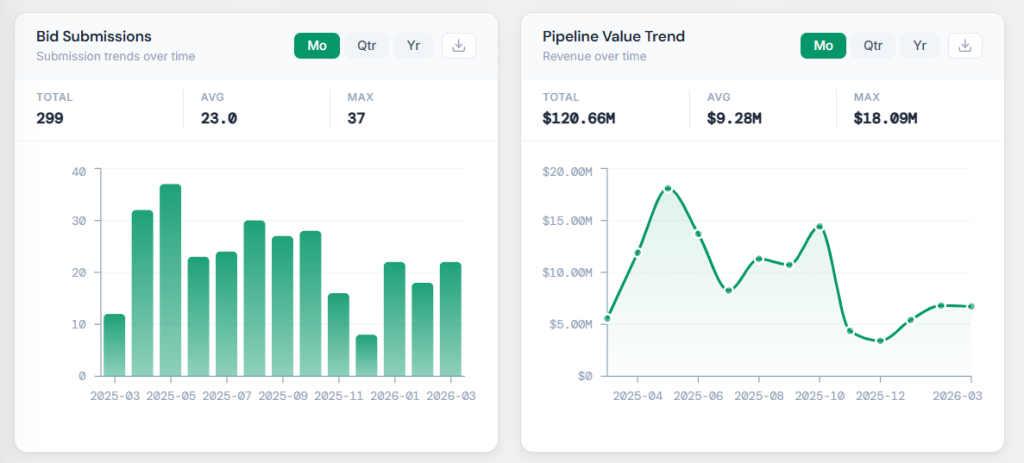
The bottom half of the dashboard transitions from static numbers to historical trends, providing a 12-month lookback at activity:
- Bid Submissions Over Time: This bar chart tracks the monthly output of the estimating department. It reveals seasonal peaks—such as the high activity seen in mid-2025—allowing managers to balance the workload across the team.
- Pipeline Value Trend: While the number of bids might fluctuate, the value of those bids is tracked via a line graph. This chart helps identify when the company is chasing high-value “whale” projects versus smaller, high-frequency “bread and butter” jobs.
Data-Driven Decision Making
The trackmybids.com interface is built for customization. With robust filtering options—including 7D, 30D, QTR, YTD, and custom date ranges—users can isolate specific periods to see how external market factors or internal changes impact their success rate.
For construction firms looking to scale, this dashboard is more than just a tracking tool; it is a roadmap for growth. By providing clear visibility into the bid pipeline, value trends, and hit rates, it ensures that every estimate submitted is a step toward a more profitable future.